Data is the engine of every modern call center. Without it, your team is flying blind.
A call center analytics dashboard brings that data to life—turning KPIs into clear, real-time visualizations your team can actually act on. Whether it’s improving response times, tracking agent productivity, or optimizing your call flows, dashboards make it easy to spot what’s working and what’s… not.
In fact, 79% of businesses say data-driven decisions are key to driving business growth¹. So if you’re still digging through spreadsheets, or worse, guessing, you’re leaving value on the table.
Key Takeaways:
- Call center analytics dashboards offer real-time insight into team and operational performance.
- Tracking the right KPIs can significantly boost service quality and agent productivity.
- Dashboards simplify analyzing call center data for decision-makers and team leads alike.
- CloudTalk’s dashboard integrates easily and is built for scaling teams.
- Real-world examples and best practices help you build a dashboard that actually works.
Start your free CloudTalk trial and see how a dashboard can change your support or sales game.
What Is a Call Center Analytics Dashboard?
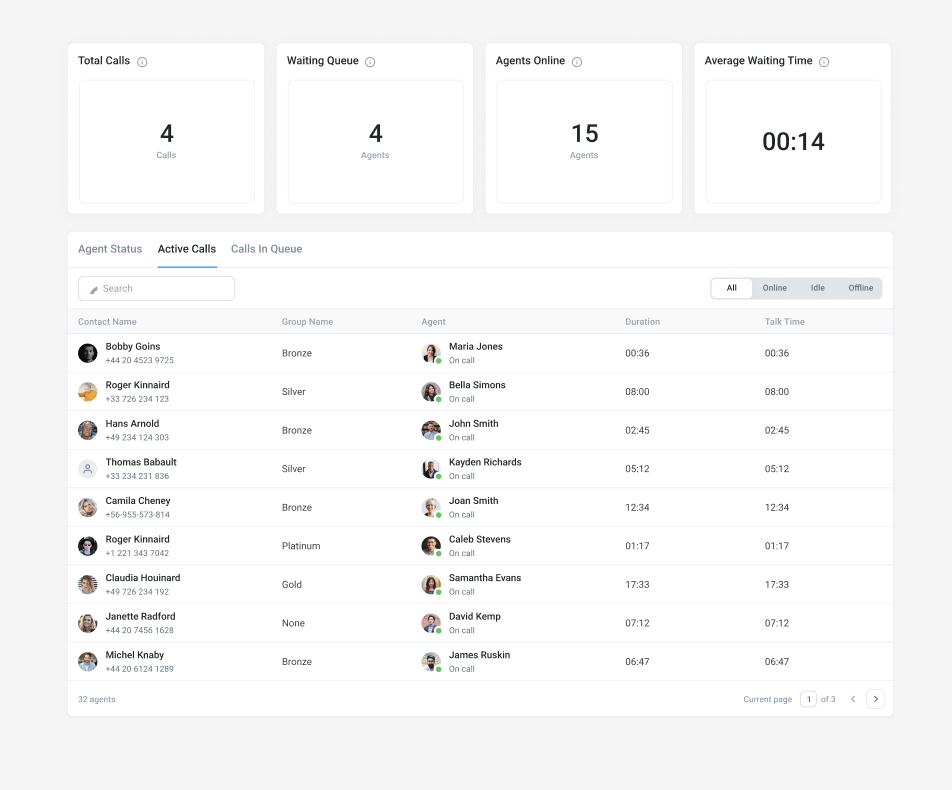
A call center analytics dashboard is a visual reporting tool that gives teams insight into real-time and historical metrics. Think of it as the control panel for your contact center—centralizing data, surfacing patterns, and revealing opportunities for improvement.
Dashboards like CloudTalk’s provide fast access to call data, so you don’t need to manually export reports every time you want answers. They’re a must-have component of effective call center data management.
How Does a Call Center Analytics Dashboard Work?
Modern dashboards connect directly with your VoIP or cloud calling system. They pull data from calls, agents, and workflows—then automatically display that info in charts, scorecards, and KPIs. This makes it easier to spot problems, track improvements, and coach your team in real time.
And yes, most top-tier platforms support real-time call center analytics so you can adapt instantly.
Get insights in the moment to help your team improve
What Should a Call Center Analytics Dashboard Include?
A good call center analytics\ dashboard isn’t just about pretty charts. It’s a real-time control panel that empowers team leaders, managers, and execs to make better, faster decisions. It should be intuitive, customizable, and focused on the metrics that matter most—driving performance, improving customer experience, and optimizing operations.
At a minimum, a complete dashboard includes:
- Call volume and trends
- Agent performance metrics
- Customer satisfaction scores
- Operational efficiency insights
- Queue and wait time data
- First Contact Resolution rates
Each of these plays a unique role in telling the full story of your contact center’s health and success.
Call Volume and Trends
Call volume is your first line of defense when analyzing contact center performance. A sharp spike? Something’s up. A dip? Are you missing calls or just in a slow period?
Your dashboard should break this down by:
- Daily/weekly/monthly call totals
- Inbound vs outbound trends
- Time-of-day spikes
- Call type breakdowns (sales, support, etc.)
This data helps you forecast staffing needs, prep for seasonal surges, and detect issues early. A sudden increase in missed calls or drop-offs? Your team might be overwhelmed—or your IVR might be misrouted.
Agent Performance
Your agents are the engine of your call center. A good analytics dashboard should spotlight:
- Average talk time
- After-call work time
- First call resolution rates
- Calls per agent per shift
- Adherence to schedule
This allows team leads to support agents more effectively, spot high-performers, and flag areas for coaching or process tweaks. You’re not just managing numbers—you’re supporting people. And with the right visibility, you can do that at scale.
Customer Satisfaction
This is where metrics meet meaning. Your dashboard should offer a snapshot of how customers actually feel, using data like:
- CSAT scores from post-call surveys
- Net Promoter Score (NPS)
- Sentiment analysis from call transcripts
- Customer effort scores (CES)
This insight helps you connect backend efficiency with frontend experience. Even if your AHT is low, if your sentiment scores are tanking, something’s broken—and this is where you’ll see it.
Operational Efficiency
Think of this as the command center of your dashboard. This section should surface your big levers for cost and performance, including:
- Average handling time (AHT)
- Service level (e.g., % of calls answered within 20s)
- Call abandonment rates
- Missed or dropped call volume
Here’s where call center reporting and analytics drive real ROI. When these numbers are optimized, you get smoother operations, happier agents, and fewer escalations—all with the same headcount.
Queue and Wait Time Metrics
Few things frustrate callers more than long wait times. With queue and wait metrics, you can:
- See real-time queue length
- Monitor average and max wait times
- Track hold time per department or agent
- Identify peak drop-off points
Used well, these insights help reduce call abandonment and optimize IVR flows. You’ll know exactly where to add staff or shift resources—before your customers hang up.
First Contact Resolution (FCR)
FCR is a holy grail metric: one call, one solution. When it’s high, your team is efficient and your customers are satisfied. When it’s low, you’re losing time—and trust.
Look for:
- FCR rate by channel (phone, chat, email)
- FCR by agent or team
- Repeat caller analysis
- Top reasons for unresolved calls
Improving FCR often means empowering agents with better tools and clearer processes. But first, you need to know where the breakdowns happen—and that’s where a smart dashboard delivers.
Call Center Analytics Dashboard Examples
Need inspiration? We’ve collected some call center dashboard examples to get you started.
CloudTalk’s KPI Dashboard
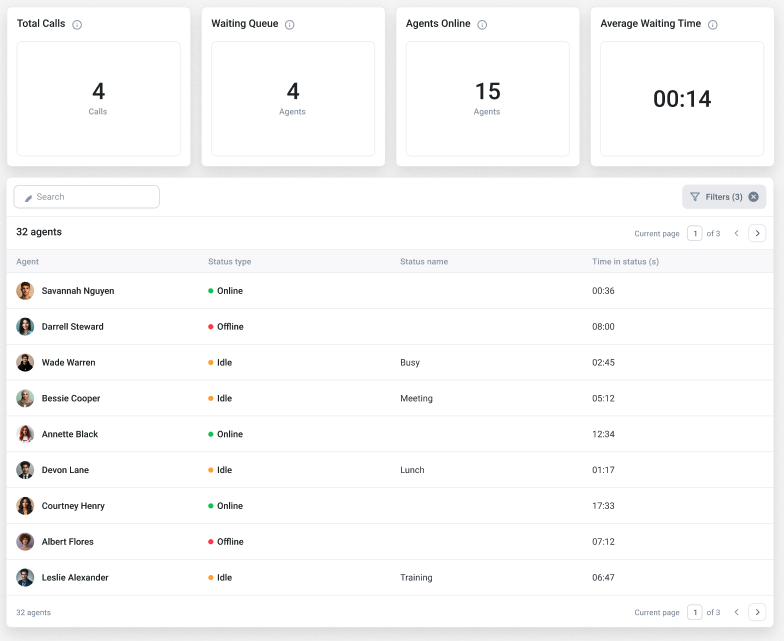
Our call center KPI dashboard gives you real-time visibility into the metrics that matter—from call volume and wait times to agent productivity and CSAT scores. It’s fully customizable, so you can track what aligns with your goals—whether that’s reducing missed calls, shortening handle times, or boosting first call resolution.
Discover the Future of Conversations
Agent-Focused Dashboards
Dive deep into individual performance with dashboards built for coaching, not just oversight. Track metrics like talk time, after-call work, and resolution rates to spot coaching opportunities, reward high performers, and support continuous growth. It’s all about giving your agents the insights they need to improve.
Executive Dashboards
Designed with strategic leaders in mind, our executive dashboards roll up data across teams, channels, and locations into one clean, digestible view. Spot trends, measure progress against KPIs, and make smarter resourcing decisions—all from a single screen.
QA and Compliance Dashboards
Ensure consistency and accountability with dashboards that surface quality assurance and compliance data. Access call recordings, flag script deviations, monitor keyword usage, and track regulatory adherence in one place—ideal for maintaining standards and staying audit-ready.
Learn how to customize your dashboard for your team’s KPIs
Key Features to Look for When Selecting a Call Center Analytics Dashboard
1. You should be able to track the KPIs you care about—not just default metrics
Your dashboard should let you build custom KPIs that reflect your team’s actual goals—not just industry benchmarks. If you can’t tailor your dashboard to your workflows, it’s just noise.
2. Real-time data should actually mean real-time
Look for a platform that lets you see what’s happening as it’s happening, so you can reassign agents, escalate tickets, or spot spikes in call volume before they become a problem.
3. You should have access to historical data that goes back more than a few weeks
A great dashboard will let you look at trends across weeks, months, even quarters—so you can identify patterns, measure campaign results, and forecast future needs with confidence. Bonus points if you can overlay multiple metrics and visualize the relationship between them.
4. Sharing should be simple, even if your boss hates dashboards
Make sure your analytics tool lets you easily share snapshots—via export, email, or even a live link. The fewer hoops you have to jump through to get someone the right data, the more useful your dashboard becomes.
5. Filters and drill-downs should help you answer questions, not just stare at numbers
You should be able to filter by agent, channel, call type, or region. Drill-down filters let you move from “What happened?” to “Why did it happen?”—without needing a BI degree.
A dashboard is only as useful as the decisions it helps you make. To turn raw data into real business value, you need more than just a nice layout—you need a system built around your team, your goals, and your operations. Here are the best practices that set high-performing call centers apart.
Best Practices When Building a Call Center Analytics Dashboard
Customization
Your dashboard should work the way your team does—not the other way around.
- Role-specific views: Tailor layouts and KPIs for agents, team leads, and execs. What matters to a frontline rep might not matter to a VP.
- Custom metrics: Create and track KPIs that reflect your business goals, whether that’s call abandonment rate, ticket resolution time, or upsell conversion.
- Branding and theming: Add your own color schemes, team naming conventions, and visual cues to reduce confusion and make dashboards easier to navigate.
- Tool integrations: Connect your dashboard with CRMs, help desks, and other systems so you can track how calls impact the rest of your business—sales, support, and beyond.
Real-Time Updates
Yesterday’s data won’t help you solve today’s problems.
- Live data streaming: Track call volume spikes, agent availability, and customer sentiment as they happen—ideal for fast decision-making and reactive support.
- Smart refresh intervals: Choose how often your dashboard updates based on your needs. Want a live pulse check every 15 seconds? You got it.
- On-call visibility: Watch individual agent performance in real time so you can offer support before a call goes off the rails.
Filtering & Drill-Down
Sometimes surface metrics aren’t enough. You need to dig deeper.
- Advanced filters: Slice your data by date range, team, shift, agent, issue type, or channel—whatever helps answer your question fastest.
- Multilevel drill-downs: Click into a KPI to break it down by agent, queue, or call reason. Go from “What happened?” to “Why it happened?” in seconds.
- Interactive elements: Dashboards should invite exploration. Clickable charts and smart tables make investigation intuitive and fast.
Real-Life Example
Example: If you see a spike in hold time for one team, drill down to identify whether it’s tied to agent availability, call complexity, or a specific IVR path.
Alerts & Notifications
The best dashboards don’t just show you problems—they flag them in real time.
- Threshold-based alerts: Get notified when your SLAs are in danger, your CSAT dips, or you hit max queue length.
- Multiple channels: Choose how you’re alerted—email, Slack, SMS, or an in-app ping in your supervisor console.
- Escalation rules: Create alert workflows so different events go to different people. For instance, missed call spikes go to team leads, while SLA breaches escalate to ops managers.
Clean Visuals
Design matters. Cluttered dashboards slow people down.
- Minimalist layouts: Prioritize the most critical KPIs—don’t overwhelm users with 20 charts when five will do.
- Visual cues: Use color coding and smart labels to highlight problem areas instantly.
- Mobile-friendly: Ensure dashboards are accessible and legible across devices, so supervisors and execs can check in from anywhere.
Set Up Your Call Center Analytics Dashboard with CloudTalk It’s easier than you think.
Here’s how to get started:
- Log into CloudTalk and navigate to the Analytics dashboard
- Choose your KPIs: Pick what matters for your team
- Customize layout: Add widgets and filters Enable alerts for metrics like missed calls or long wait times
- Share or schedule reports with stakeholders
- Review regularly to optimize team and workflows
For more advanced dashboards, you can connect integrations or layer in agent reporting.
Wrapping Up: Better Data, Better Decisions
A well-built call center analytics dashboard isn’t just a reporting tool—it’s your frontline command center. It helps you spot bottlenecks, coach your agents, improve customer experience, and make smarter decisions every day.
By choosing a platform that offers real-time insights, customizable metrics, and built-in alerts, you’re setting your team up for faster responses, better outcomes, and long-term growth.
Whether you’re building your first dashboard or refining an existing one, keep the focus on clarity, relevance, and actionability. The right data, in the right hands, changes everything.
Try CloudTalk’s dashboard for easy setup, and powerful insight to build a stronger call center team.
Sources:


