Top 21 Call Center Metrics & KPIs to Boost Customer Experience
95% of call center pros rank customer satisfaction as their top priority¹—but focusing on that alone can cloud your decision-making. Ignoring key call center performance metrics or clinging to outdated standards can hurt efficiency and growth.
TL;DR:
Here are the 10 main key call center metrics you should track to improve analytics and reporting (out of the 21 that made our list):
-
01
First Call Resolution (FCR) – % of issues resolved on the first call
-
02
Average Handle Time (AHT) – Average time spent per interaction
-
03
Service Level – % of calls answered within target time
-
04
Call Abandonment Rate – % of callers who hang up before reaching an agent
-
05
Calls Handled – Total number of calls managed by agents
-
06
Adherence to Schedule – How closely agents follow their assigned schedules
-
07
Agent Utilization Rate – % of time agents spend on productive tasks
-
08
First Response Time (FRT) – Average time to first response
-
09
Customer Satisfaction (CSAT) – Customer satisfaction after interactions
-
10
Net Promoter Score (NPS) – Likelihood of customers recommending your business
What Are Call Center Metrics?
Call center metrics are key performance indicators (KPIs) that measure a call center’s performance. They provide information about agent efficiency, call center operations, and customer satisfaction. By analyzing these metrics, managers can identify areas for improvement, achieve their goals, and deliver a better customer experience.
“In God we trust; all others must bring data.” – W. Edwards Deming, American Business Theorist

Why Tracking Call Center Metrics Matter
Tracking metrics and call center KPIs allows managers to make decisions based on real data instead of assumptions. These measurements help identify what’s working well, spot potential problems early, and improve both agent performance and the overall customer experience.
Here are the main reasons why tracking contact center metrics are essential for success:
- Gain visibility into operational performance: Metrics give you a clear picture of how your call center performs daily. Imagine that you realize wait times triple during peak hours. With that information, you can adjust agent schedules to reduce delays and keep customers happy.
- Improve your customer satisfaction: By tracking indicators like first contact resolution or average call duration, you can identify weak spots in the customer journey. Suppose you notice that many customers have to call multiple times for the same issue—that’s a sign your processes need fixing to offer a faster, smoother experience.
- Boost agent productivity: Metrics reveal which agents handle the most calls, resolve issues quickly, or might need extra support. Let’s say one agent consistently takes twice as long as others to handle inquiries. These call center analytics insights help you provide targeted training or better tools to help them work more efficiently.
- Catch problems and inefficiencies early: By consistently monitoring data, you can anticipate issues before they affect your service. For example, if you spot a spike in calls about a specific product, you can quickly investigate and address the cause before it damages your brand reputation or overwhelms your team.
“If you can’t measure it, you can’t improve it.” — Peter F. Drucker, Consultant and Educator
Top 21 Call Center Metrics to Track & Success
Check out the table below for a clear and concise overview of the key call center metrics that matter most. Dive in to understand which metrics can boost your team’s performance and customer satisfaction.
| Category | Metric | Description | Formula |
|---|---|---|---|
| Efficiency & Productivity | First Call Resolution (FCR) | % of issues resolved on the first call | (Resolved calls on first contact / Total calls) × 100% |
| Average Handle Time (AHT) | Average time spent per call | (Total talk time + hold time + after-call work) / Number of calls | |
| Service Level | % of calls answered within target time | (Calls answered within target time / Total calls) × 100% | |
| Call Abandonment Rate | % of calls where customer hangs up before answer | (Abandoned calls / Total calls) × 100% | |
| Calls Handled | Total number of calls managed | Count of answered calls | |
| Adherence to Schedule | % time agents follow their assigned schedule | (Time on schedule / Total scheduled time) × 100% | |
| Agent Utilization | % time agents are actively handling calls | (Active call time / Available working time) × 100% | |
| Customer Experience & Satisfaction | First Response Time (FRT) | Average time it takes to send the first reply to a customer query. | Total of all FRTs / Total number of calls |
| Customer Satisfaction (CSAT) | Score of customer satisfaction after call | (Sum of satisfied responses / Total responses) × 100% | |
| Net Promoter Score (NPS) | Likelihood to recommend service | % Promoters – % Detractors | |
| Agent Effort Score | Ease for customers to resolve their issues | Average customer rating on effort scale | |
| Call Management & Quality | Transfer Rate | % calls transferred between agents or departments | (Transferred calls / Total calls) × 100% |
| Repeat Call Rate | % customers who call again about the same issue | (Repeat calls / Total calls) × 100% | |
| Average Call Time | Average time spent actively talking | Total talk time / Number of calls | |
| Total Resolution Time | Total time to fully resolve an issue | Time from first call to resolution | |
| Costs & Resources | Cost per Call | Average cost per handled call | Total cost of calls / Number of calls |
| Occupancy | % time agents spend actively working vs idle | (Active call time / Total logged-in time) × 100% | |
| Peak Hour Traffic | Number of calls during peak hours | Count calls during busiest hours | |
| Call Flow & Queue | Call Arrival Rate | Number of incoming calls in a time period | Number of calls / Time interval |
| Active Waiting Calls | Number of calls currently in queue | Count calls waiting in queue | |
| Percentage of Calls Blocked | % calls not connected due to busy lines | (Blocked calls / Total calls) × 100% |
Call Center Efficiency Metrics
#1 First Call Resolution (FCR)
What It Is
The first call resolution is the percentage of cases where the customer’s issue is fully resolved during the first call, without requiring any follow-ups.
Why It’s Important
Resolving issues on the first contact takes away the frustration customers feel when they have to call back multiple times. In fact, 95% of customers will stick with a company if their problem is fixed right away2.
How to Measure It?
How to Measure It?
How to Stay on Top of This Metric
A good FCR rate is usually between 70% and 79%3, with over 80% considered world-class. Tools like CloudTalk’s Skills-Based Routing help you achieve this by connecting customers to the most qualified agent for their issue—such as directing technical questions to a specialist—so problems get solved faster and transfers or repeat calls are minimized.

#2 Average Handle Time (AHT)
What It Is
The average handle time is the standard amount of time an agent spends on a call, including talk time, hold time, and after-call work.
Why It’s Important
Up to 60% of customers hang up if they have to wait on hold for more than two minutes4. That’s why keeping the AHT low is so important—shorter, efficient calls reduce hold times and wait times, helping to keep customers satisfied and less likely to abandon the call.
How to Measure It?
How to Measure It?
How to Stay on Top of This Metric
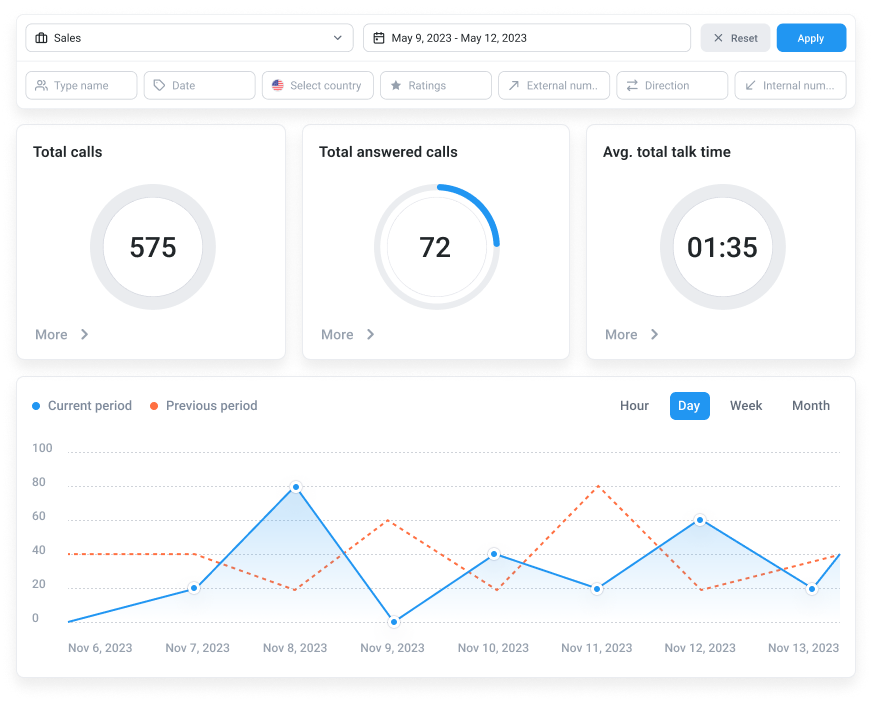
The typical industry standard for AHT is around 6 minutes5, but this can vary significantly by sector and interaction type. Not sure where your team stands? Use our free AHT calculator to calculate your current average handle time instantly — then use CloudTalk’s Analytics to track it in real time with detailed statistics available by day, week, or month. This helps you monitor contact center performance metrics closely and make quick improvements when needed.

#3 Service Level
What It Is
The percentage of calls answered within a predefined timeframe (e.g., 80% of calls answered within 20 seconds).
Why It’s Important
Meeting service level targets ensures customers aren’t kept waiting too long, reducing call abandonment and improving overall customer satisfaction. In fact, 72%6 of customers expect a response within 30 minutes of reaching out.
How to Measure It?
How to Measure It?
How to Stay on Top of This Metric
The industry standard for service level is often defined as answering 80% of incoming calls within 20 seconds, known as the “80/20 rule.” Stay ahead with a dashboard like CloudTalk’s, which shows live call center data visualization on key metrics like wait times, abandoned calls, and active queues. This real-time view lets managers spot issues fast and act to keep response times on target.

#4 Call Abandonment Rate
What It Is
The percentage of calls where customers hang up before being connected to an agent.
Why It’s Important
Imagine a call center that receives 200 calls a day and has a 15% abandonment rate, meaning it could lose 30 potential customers daily. With an average customer value of $150, that’s around $1,500 lost per day. Beyond revenue, high abandonment rates also hurt satisfaction and increase churn.
How to Measure It?
How to Measure It?
How to Stay on Top of This Metric
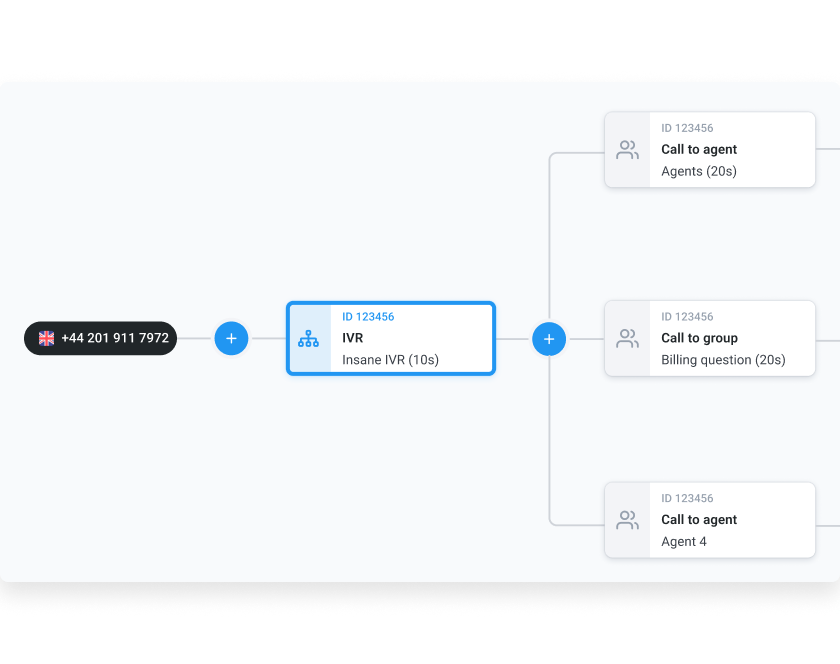
A low abandonment rate is key to a well-performing call center, with anything under 5%7 considered a solid benchmark. To help you reach—or even beat—this target, use tools like CloudTalk’s IVR system to guide customers through personalized routing options, quickly connecting them to the right agent and reducing the chances of them hanging up out of frustration.
#5 Calls Handled
What It Is
The total number of calls that agents successfully manage within a specific period.
Why It’s Important
Tracking how many calls your team handles helps managers see how efficiently the team is working and whether there are enough agents available. If the number of handled calls is lower than expected, it could mean agents are too busy, calls aren’t being routed well, or there’s a problem slowing things down.
How to Measure It?
How to Measure It?
How to Stay on Top of This Metric
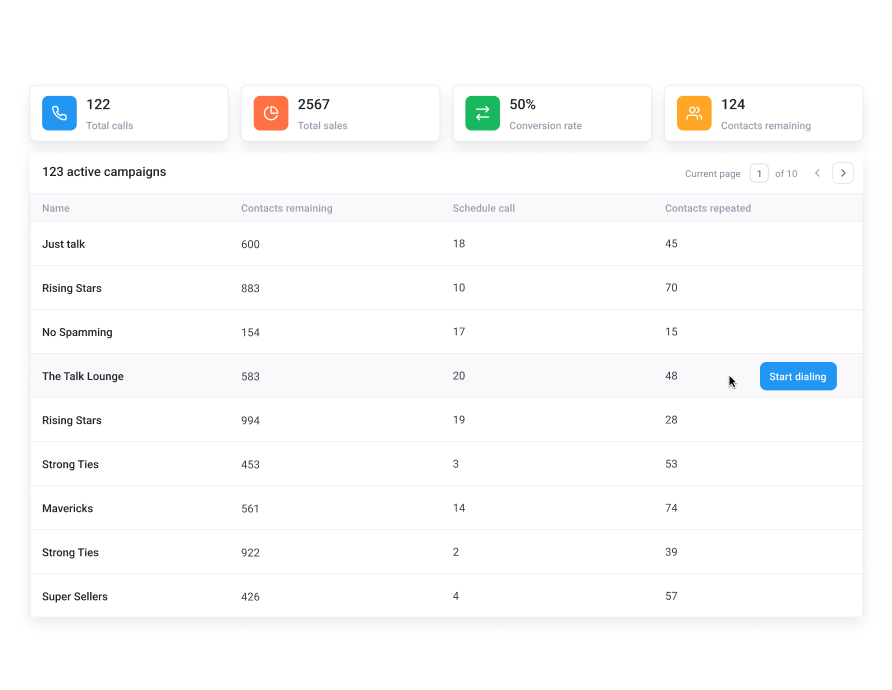
Recent data shows that small call centers usually handle about 50 to 1004 calls per agent daily. This number can change based on the complexity of the calls, the industry, and the amount of automation used. Luckily, modern tools like automatic dialers speed up the process. For example, CloudTalk’s Power Dialer helps agents make calls faster, potentially doubling call volumes and reducing wait times.

#6 Adherence to Schedule
What It Is
The extent to which agents stick to their assigned working hours and breaks.
Why It’s Important
When agents stick to their schedules, call centers can maintain the right number of staff to handle incoming calls, especially during busy periods. On the contrary, poor adherence can lead to overstaffing, which raises costs, or understaffing, which causes long wait times and affects service quality.
How to Measure It?
How to Measure It?
How to Stay on Top of This Metric
Most call centers aim for a schedule adherence rate of 85% to 95%8. To stay within this target, it’s important to track how agents spend their time, including the number of calls they handle, how long those calls last, and time spent on breaks or other tasks. Detailed agent reports help managers spot issues early and provide feedback or coaching to keep schedules on track.

#7 Agent Utilization Rate
What It Is
The percentage of an agent’s working hours spent on customer-related, productive tasks like handling calls and follow-ups.
Why It’s Important
A high Utilization Rate means agents are actively handling calls and service tasks, making good use of their time. A low rate shows agents are spending too much time idle or on non-essential work, which can increase costs and reduce overall efficiency.
How to Measure It?
How to Measure It?
How to Stay on Top of This Metric
A typical target for agent utilization rate is between 75% and 85%*, though it can vary based on your call center’s priorities. Stay on top of it with a Real-Time Dashboard like CloudTalk’s, which provides live insights into agent activity, call queues, and key KPIs.
Customer Experience & Satisfaction
#8 First Response Time (FRT)
What It Is
The average time it takes for an agent to answer a customer call or respond to an inquiry.
Why It’s Important
66%9 of customers say that valuing their time is the most important thing a company can do to deliver good service. By reducing First Response Time (FRT), you show customers their time is a priority—improving satisfaction, reducing frustration, and increasing the chances they’ll stay loyal to your business.
How to Measure It?
How to Measure It?
How to Stay on Top of This Metric
While benchmarks vary by industry, a good First Response Time (FRT) for phone calls is around 3 minutes10. Tools like CloudTalk’s Call Queues automatically place incoming calls in a virtual line when agents are busy, making sure no call gets missed or dropped. This helps reduce long wait times and keeps customers from leaving frustrated.
#9 Customer Satisfaction (CSAT)
What It Is
A metric that measures how satisfied customers are with the service they received, usually collected through post-interaction surveys.
Why It’s Important
CSAT directly reflects customer happiness and loyalty. High satisfaction scores mean customers feel valued and understood, which increases the chances they will continue doing business with your company and recommend it to others.
How to Measure It?
How to Measure It?
How to Stay on Top of This Metric
A CSAT score between 75% and 84%3 is considered good performance for most call centers. To track this metric, you can set up automated post-call surveys via IVR or keypad input, allowing customers to rate their experience right after the call while it’s still fresh.
What It Is:
A measure of customer loyalty based on how likely customers are to recommend your company to others, often gathered through surveys asking, “How likely are you to recommend us?”
#10 Net Promoter Score (NPS)
Why It’s Important
NPS predicts future growth by showing how many customers are promoters, passives, or detractors. A high NPS suggests strong customer advocacy, while a low score highlights areas needing improvement to reduce churn.
How to Measure It?
How to Measure It?
How to Stay on Top of This Metric
A CSAT score between 70 and 90* is generally considered a good range11. To improve customer satisfaction, you can integrate your call analytics software with NPS survey tools or trigger follow-up calls to detractors, allowing you to gather valuable feedback and take action. For example, you can connect Nicereply with a call center reporting software like CloudTalk to automatically send CSAT, CES, and NPS surveys via SMS after each call.
#11 Agent Effort Score
What It Is
A metric that shows how easy or difficult it is for customers to get their issues resolved.
Why It’s Important
According to Gartner, 96% of customers become disloyal after high-effort interactions12. When customers have to work too hard to get help or solve a problem, they feel frustrated and undervalued. This negative experience damages their trust and makes them more likely to switch to a competitor who offers easier and faster service.
How to Measure It?
How to Measure It?
How to Stay on Top of This Metric
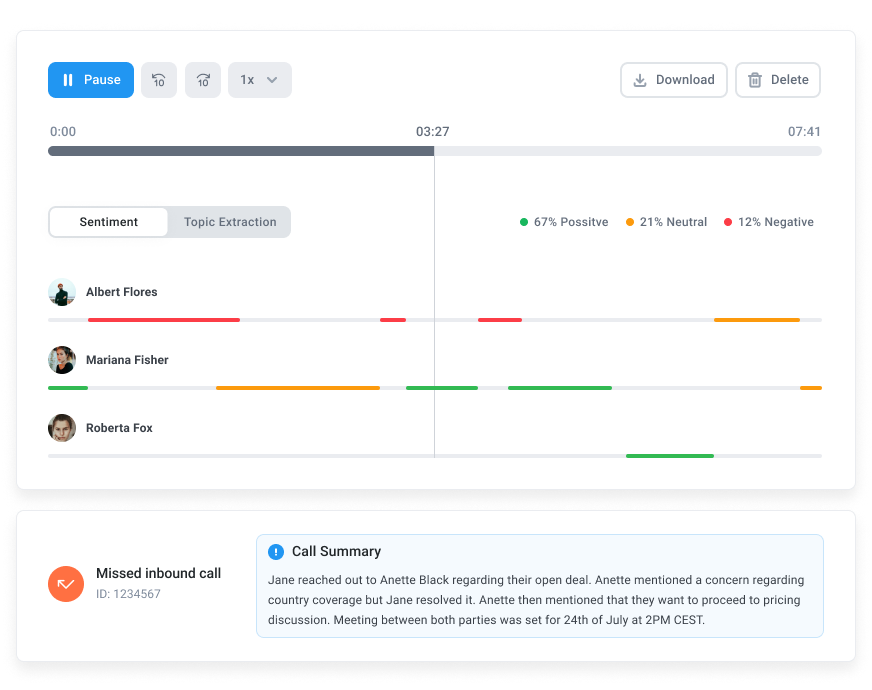
To track call center agent performance metrics and improve the agent effort score, you can listen to recorded calls to identify if agents are clear, helpful, and resolve issues efficiently without making customers repeat themselves.
Call Management & Quality
#12 Transfer Rate
What It Is
The percentage of calls transferred from one agent or department to another.
Why It’s Important:
A high transfer rate means customers are being passed between agents too often, leading to frustration and longer resolution times, while keeping it low helps connect callers with the right agent on the first try. In fact, when a customer is transferred, CSAT is 12% lower, and FCR is 14%13 lower than when a customer is not transferred.
How to Measure It?
How to Measure It?
How to Stay on Top of This Metric
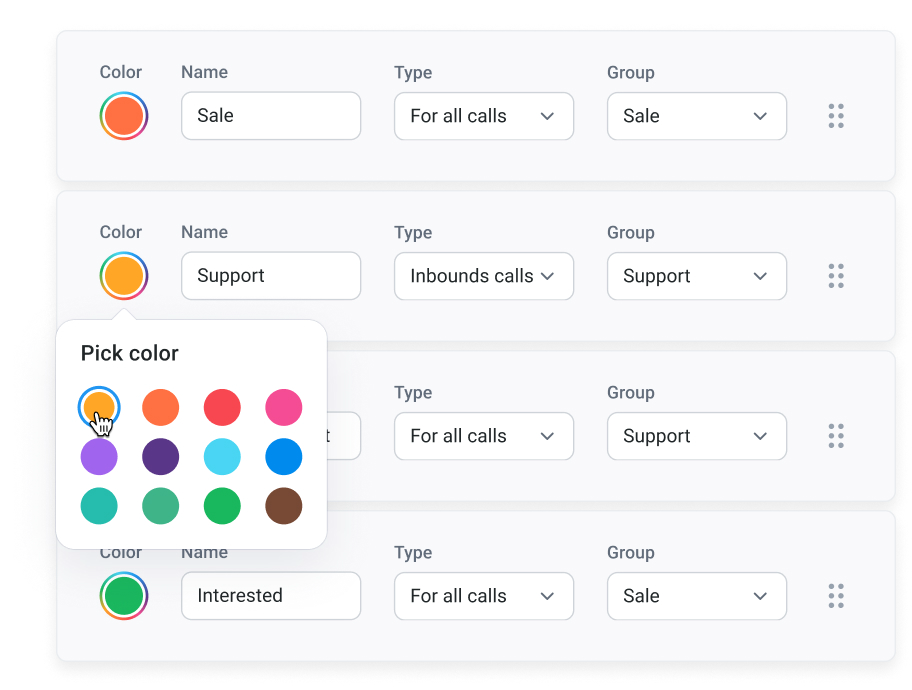
Implement mandatory call tagging so agents must label calls after each interaction. Custom tags (such as “Transferred”) let you easily filter and report on transferred calls, ensuring you track every instance accurately.
#13 Repeat Call Rate
What It Is
The percentage of customers who call back about the same issue within a given period.
Why It’s Important
Repeat call rate shows how well your team resolves customer issues on the first try. If this rate is high, it may indicate that problems aren’t being fully solved, agents need better training, or internal processes aren’t working as they should.
How to Measure It?
How to Measure It?
How to Stay on Top of This Metric
Now, with AI, it’s much easier to track repeat calls. For example, CloudTalk’s AI-powered features automatically transcribe conversations, tag them by topic or issue, and link related interactions, helping teams identify recurring problems without the need for manual review.
#14 Average Call Time
What It Is
The average time spent on a call from answer to termination, excluding after-call work.
Why It’s Important
This metric helps identify if conversations are too long, which may indicate efficiency issues, or too short, which could suggest rushed and low-quality service. Monitoring this time is key to balancing productivity, service quality, and customer satisfaction.
How to Measure It?
How to Measure It?
How to Stay on Top of This Metric
The average call duration for inbound contact centers is about 4 minutes14. To track this metric, tools like CloudTalk offer detailed call center metrics analytics and reporting on call performance, including average call length. This helps managers spot bottlenecks, monitor agent efficiency, and make targeted improvements.
#15 Total Resolution Time
What It Is
The average total time it takes to fully resolve a customer’s issue, including all contacts and follow-ups.
Why It’s Important
61%15 of consumers say an excellent support experience means getting a quick resolution, making this metric essential for maintaining positive customer relationships and loyalty.
How to Measure It?
How to Measure It?
How to Stay on Top of This Metric
A good average resolution time typically falls between 5 and 7 minutes16, though this can vary by industry. Tools like CloudTalk’s Call Monitoring and Whisper Coaching help you reach this benchmark by letting supervisors listen to live calls and discreetly guide agents in real time, speeding up issue resolution without interrupting the customer experience.
Costs & Resources
#16 Cost per Call
What It Is:
The average cost incurred by the call center to handle a single customer call.
Why It’s Important
It helps businesses understand how much they spend handling each customer interaction, including agent salaries, technology, and overhead costs. By keeping this cost under control, companies can improve profitability, allocate resources smartly, and maintain service quality without overspending.
How to Measure It?
How to Measure It?
How to Stay on Top of This Metric
To keep your cost per call under control, it’s essential to regularly monitor your call data and spot inefficiencies early. With CloudTalk’s Analytics and customizable reports, you can track key metrics, filter results by team or campaign, and quickly identify what’s driving up costs—whether it’s long call times, missed calls, or uneven staffing.
#17 Occupancy
What It Is
The percentage of time agents spend actively handling calls versus idle time.
Why It’s Important
The occupancy rate directly reflects how efficiently a call center utilizes its workforce. A rate that is too low means agents are underutilized, leading to unnecessary labor costs and wasted resources, while a rate that is too high means agents are overworked, risking burnout and increased turnover.
How to Measure It?
How to Measure It?
How to Stay on Top of This Metric
The typical industry benchmark for call center occupancy rates falls between 75% and 85%3. With tools like CloudTalk’s Power Dialer, you can automate dialing so agents can quickly move from one call to the next, reducing downtime and increasing occupancy.
#18 Peak Hour Traffic
What It Is
The volume of calls received during the busiest hours of operation.
Why It’s Important
Knowing your peak hours helps you schedule the right number of agents when call volume is highest, ensuring customers don’t wait long and service runs smoothly.
How to Measure It?
How to Measure It?
How to Stay on Top of This Metric
Using comprehensive contact center analytics tools lets you track call volumes by time of day, missed calls, answer rates, and other key metrics. This data provides a historical view, helping you identify recurring peak hours and patterns over days or weeks.
Call Flow & Queue
#19 Call Arrival Rate
What It Is
The number of incoming calls received in a set timeframe.
Why It’s Important
Understanding when call volumes spike allows managers to schedule enough agents during busy times, preventing long wait times and missed calls. If you fail to plan for peak periods, you risk losing valuable customer interactions—and poor resource allocation from inaccurate CAR estimates can cost businesses up to 10%17 of their annual revenue.
How to Measure It?
How to Measure It?
How to Stay on Top of This Metric
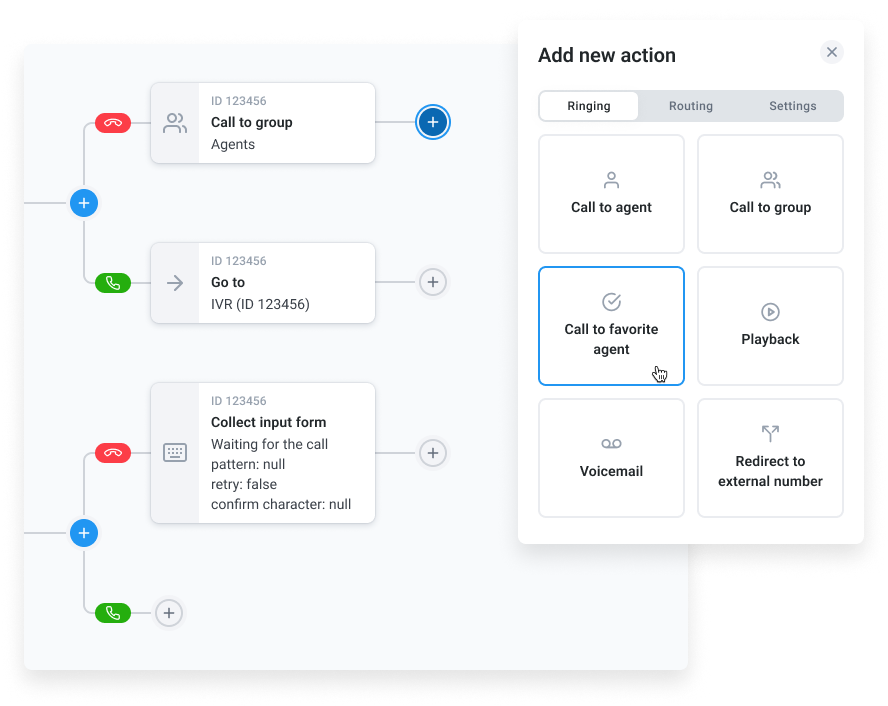
A “good” call arrival rate is not a fixed number—it depends on your call center’s size, industry, and business goals. However, if you want to improve it, tools like CloudTalk’s Call Flow Designer lets you customize how incoming calls are routed, sending each caller to the right agent or department based on their needs. With a tailored workflow, your team can handle more calls efficiently without getting overwhelmed.
#20 Percentage of Calls Blocked
What It Is
The proportion of inbound calls that fail to connect with an agent or the call distribution system.
Why It’s Important
A high number of blocked calls means customers can’t get through, causing frustration and hurting your company’s reputation. It’s also a sign that your call center isn’t handling demand efficiently.
How to Measure It?
How to Measure It?
How to Stay on Top of This Metric
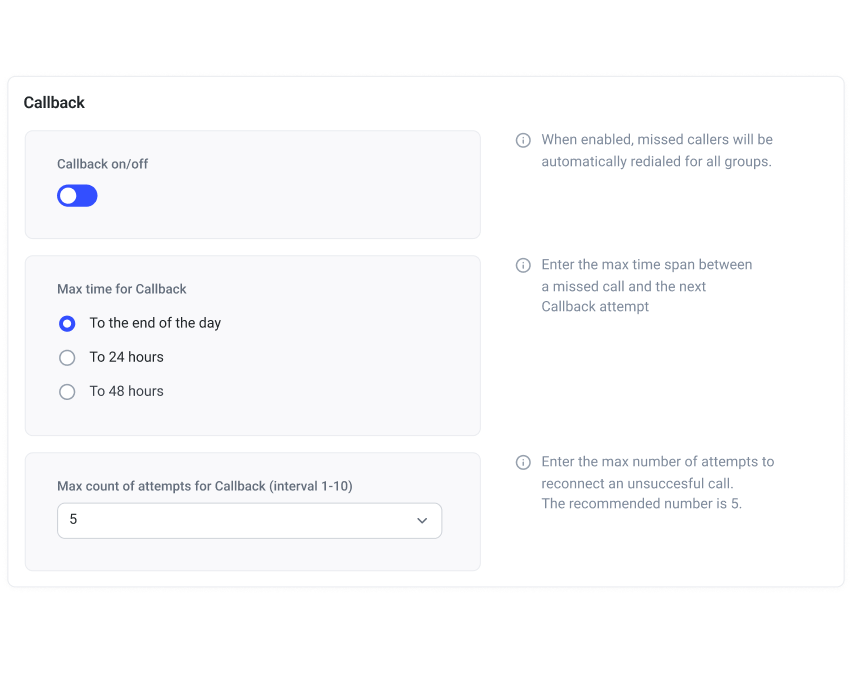
Industry benchmarks suggest that an acceptable PCB rate is between 2% and 5%18 . To keep the PCB rate within that range, you can use features like CloudTalk’s callback option, which lets customers request a return call when lines are busy, ensuring their calls get answered even during peak times.
#21 Active Waiting Calls
What It Is
The number of calls currently waiting in the queue to be answered.
Why It’s Important
High numbers of active waiting calls often signal long wait times, leading to customer frustration, poor experiences, and decreased customer retention. Monitoring this metric allows managers to identify when customers are waiting too long and take steps to reduce wait times, such as adjusting staffing or improving call routing.
How to Measure It?
How to Measure It?
How to Stay on Top of This Metric
Use tools like CloudTalk’s Call Queuing, which places calls in virtual queues and routes them to agents based on predefined rules, ensuring no customer waits indefinitely or gets dropped due to unavailable agents.
How to Boost Your Call Center Metrics
Here’s a step-by-step guide with actionable tips to improve your call center metrics effectively:
Start by Evaluating Your Current Performance
Analyze your existing data—look at customer satisfaction scores, call resolution rates, average handling time, and abandonment rates. Gather feedback from agents and managers to get a clear picture of what’s working and what needs improvement.
Set Clear, Measurable Goals That Drive Progress
Define specific targets based on your current performance and business objectives. For example, aim to reduce average handle time by 10% or increase first call resolution within three months. Clear goals help your team focus and measure progress effectively.
Make Smarter Decisions with Real-Time Call Center Analytics
Use real-time dashboards and detailed reports to track key metrics continuously. These tools help you spot trends, identify bottlenecks, and make data-driven decisions quickly, ensuring you stay on top of your call center’s performance.
Optimize Call Routing and Staffing for Peak Efficiency
Customize call flows and routing rules to direct customers to the right agent or department the first time. This reduces transfer rates and wait times, improving customer experience while balancing agent workload efficiently during peak hours.
Empower Your Agents with Training and Support
Use performance data to identify skill gaps and provide personalized coaching. Regular training updates and accessible knowledge bases empower agents to handle calls more effectively and improve key metrics like call resolution and customer satisfaction.
Harness Technology and Automation to Work Smarter
Integrate tools like IVR, Power Dialers, and Smart Dialers to automate routine tasks and optimize call handling. Automation reduces agent downtime, enhances workflow efficiency, and allows your team to focus on complex customer issues.
Keep Improving by Monitoring and Adjusting Strategies
Continuously track your KPIs and gather customer feedback to evaluate the impact of your initiatives. Use these insights to refine workflows, update training, and adapt technology use, ensuring your call center metrics improve steadily over time.
Turn Metrics Into Meaningful Customer Outcomes
In summary, tracking call center metrics is essential for delivering excellent customer experiences. Key indicators like average handle time, first call resolution, and customer satisfaction reveal how your team performs and where to improve.
With CloudTalk’s Real-Time Dashboards, advanced Call Analytics, Agent Reporting, and Smart Routing, managing these metrics is simple and effective. Try it today to see how smarter call center management can boost your customer satisfaction.
Want to boost customer satisfaction? Turn data into results with CloudTalk.

Sources:
- The Top 10 Most Important Contact Centre Metrics
- FCR Metric Operating Philosophy
- Call Center Statistics — Giva
- Call Center Statistics — LiveAgent
- Industry Standards & Metrics for Contact Centres
- Improve Customer Support with Mass Comments in Zoho Desk
- Call Abandonment Rate: A Comprehensive Guide
- Unlocking Success: Master Adherence & Conformance in Your Call Center
- Consumers Drive Channel Preference to Achieve Effortless Customer Service
- First Response Time KPI Explained
- Customer Satisfaction Score (CSAT) Explained
- Effortless Experience Explained
- Call Transfer & Hold: Performance Impact on CSAT and FCR
- What Is the Average Talk Time for Contact Centres Nowadays?
- Resolution Time: What It Means for Customer Service
- Average Resolution Time Glossary
- How to Boost Call Arrival Rate
- How to Reduce Percentage of Calls Blocked


