Did you know the most important metrics of a seamless customer experience are the speed of response (63%), speed of resolution (57%), and agent availability (49%)?
Closely followed by the agent’s knowledge and expertise (49%), and politeness and empathy (43%).
This means you should revisit your team’s KPIs and how your call center operates to keep up with shifting demand and expectations.
For instance, how long will callers wait in your queue before they hang up? How often are their queries resolved the first time? How satisfied are they overall with the service your call center offers? Call center reporting can provide all those answers and give you a more transparent overview.
You can’t improve what you can’t measure, so buckle up for a deep dive into the ins and outs of call center reporting that will help you get it right.
Key Takeaways:
- Efficient call center reports are a key component of success. Focus on KPI prioritization, benchmark setting, holistic considerations, and goal establishment for continuous enhancement.
- Contact center reporting solutions like CloudTalk streamline reporting with real-time metrics, dashboards, and insights. That elevates call center efficiency through comprehensive data, aiding informed decision-making.
- Continuous refinement, from alpha reports to end-user testing, ensures adaptability to industry changes. It results in relevant data for agile and effective decision-making.
Turn your call center data into results
What is Call Center Reporting?
Call center reporting—or contact center reporting for those of you with diverse communication channels—is the process of transforming raw data (real-time and historical) into actionable insights.
Those insights are presented as easy-to-understand call or contact center reports, often focused on Key Performance Indicators (KPIs). The goal is to boost customer experience and agent performance.
Commonly tracked data streams include those from your Interactive Voice Response (IVR), Automatic Call Distributor (ACD), and Workforce Management System (WFM).
Once those data points have been gathered, they can be organized and categorized into your KPIs. We’ll get into some examples of great KPIs to track as part of your call or contact center reporting below.
Maximize performance with call center Analytics
Call Center Reporting KPIs
The most useful call center report is one that’s customized to your call or contact center. It should provide insights into what you know to be the most important indicators of success and high performance for your business.
Let’s take a look at some KPIs you might choose to build your call center Analytics and reporting around:
Business Critical KPIs
Aren’t all KPIs “business critical”? you ask. Well, yes. However, these are the indicators that can give you a top-down, 360-degree view of your operations. As opposed to those that dig down a little deeper into the specifics.
Net Promoter Score (NPS)
Similar to Customer Satisfaction (CSAT), this metric attempts to gauge your customers’ happiness. NPS has a business-centric twist, though: it measures the likelihood that your customers will recommend your product to somebody else.
Global Benchmark: Varies significantly between industries, with the median NPS being +44
Average Turnover Rate
This metric quantifies the rate of turnover among your call center agents. Call centers get a bad rap for high turnover, but it doesn’t have to be so for your operation.
Why is that important? Placing an emphasis on cohesion among your team will lower turnover and increase efficiency.
Before you can improve turnover, though, you need to know where you stand. That’s where call center management reports focused on turnover rate come in.
Global Benchmark: 30-45%
Cost Per Contact
You might well say that you can’t put a price on outstanding customer service. What you can do, though, is quantify your Cost Per Contact. That is the average cost to your call or contact center of each customer interaction.
You calculate cost per contact by dividing your total operational expenditure by the number of calls or contacts handled in a given time period.
Why is that important? Tracking Cost Per Contact over time helps you gauge the success of cost-cutting or efficiency measures.
Global Benchmark: N/A
Agent Engagement Score
47% of call center managers consider agent turnover and absenteeism their biggest issues when managing a call center.
Agent engagement scores give you a measure of how engaged agents are with their day-to-day work.
Global Benchmark: 30% highly engaged, 11% somewhat engaged, 54% somewhat disengaged, and 5% highly disengaged.
Customer Critical KPIs
Call center reports shouldn’t all be top-level, birds’ eye view affairs. Sometimes it also pays to zoom in specifically on your customers. These are some customer-level KPIs to use as part of your contact center reporting.
First Contact Resolution (FCR)
This metric measures the rate at which your customers’ issues are resolved by the first agent with whom they speak.
Why is that important? The higher the percentage, the happier your customers are.
With CloudTalk’s Preferred Agent feature, you can match customers with agents they’ve previously interacted well with, ensuring a smoother experience on future calls.
Global Benchmark: 70-75%
Service Level
A call center’s service quality is another of the most crucial call center metrics for analytics and reporting. It’s defined by the percentage of inbound calls answered by agents within a given amount of time. It’s usually given as a pair of numbers, the most popular being the vaunted 80/20 global call center standard.
Having an 80/20 service level for your call center simply means that 80 percent of incoming calls are answered by your agents within 20 seconds. It’s an easy metric to measure and one that gives a good, broad idea of the attentiveness and efficiency of your call center staff.
Why is that important? It’s a good foundation on which to build a call center benchmarking report to track performance over time.
Global Benchmark: Most commonly, 80% of calls answered within 20 seconds = 80/20
Average Abandonment Rate
This KPI measures the percentage of customers who hang up the phone before being connected to an agent.
This depends on how busy and well-staffed your call center is — the more agents there are to handle incoming calls, the quicker your customers will connect with an agent. So, the less likely they’ll be to hang up before speaking with someone.
Why is that important? It’s an important KPI to track to assess overall efficiency. Anywhere from 5-8% is a good benchmark to aim for.
Global Benchmark: 12-20%
Blocked Calls
This metric is the percentage of customers who called your company and heard a busy tone.
The percentage value is directly related to how well-staffed a business is, because customers only hear a busy tone when all agents are busy helping other people.
Why is that important? Hearing a busy tone is frustrating for everyone, especially when they’re trying to contact a business. This number should be kept as low as possible.
Global Benchmark: Less than 2%
Average Wait Time (AWT)
You get this metric by dividing the total amount of time customers spent in caller queues for a given period by the number of calls that were answered in that period.
Why is that important? It’s an easy metric to calculate and it gives you a good idea of how satisfied your customers are with the attentiveness of your agents.
According to recent Call Centre Helper research, 36% of callers will only wait up to one minute before abandoning a call to a call center. Clearly it’s important to keep your average wait time low!
Global Benchmark: 30 seconds to 1 minute
Process Critical KPIs
Contact center reporting and analytics isn’t only about tracking your business’s bottom line and your customer satisfaction levels. It’s also about assessing your workflows and doing what you can to improve efficiency. That’s what process critical KPIs help with.
Average Speed to Answer
This figure indicates the average amount of time it takes your agents to answer the phone, as measured from the beginning of the ringing process.
Notably, this excludes the time it takes your customers to navigate through your IVR system, should you have one.
Why is that important? It’s a pretty pure measure of your agents’ ability to handle phone calls promptly as they come in.
Global Benchmark: 28 seconds
Average Call Duration
Easy to track and understand, average call duration is one of the most important call center efficiency metrics out there. The average call duration is around four minutes. If yours is lower, your agents are likely working efficiently.
Why is that important? The average duration of inbound and outbound calls will give you important insight into how competent your agents are in handling their responsibilities on a day-to-day basis.
Global Benchmark: 6 minutes and 3 seconds
Call Arrival Rate
Call arrival rate gives you an idea of when your call center is fielding the highest and lowest volume of inbound calls.
Why is that important? Tracking this KPI and using employee scheduling software will allow you to craft informed, smart work schedules for your agents so you’re always adequately staffed, even on the busiest of days.
Global Benchmark: Will vary from one call center to the next
Average Handle Time (AHT)
This metric measures the length of your agents’ interactions with customers from start to finish.
AHT is a good metric for evaluating the efficiency of your agents, and your call center reporting software should let you create reports on individual agents. Make sure, however, that you don’t place too much of an emphasis on having a low AHT — rushed agents are prone to make more mistakes.
Global Benchmark: Six minutes
Average After-Call Work Time (ACW)
After every call, an agent has to work on important admin tasks. These include completing transaction reports, updating databases, and reporting issues. Keeping a low average ACW time improves the efficiency of your call center.
CloudTalk, for example, has several handy features, including easy Call Tagging and Workflow Automation, speeding up manual tasks so agents can focus on providing excellent customer service.
Global Benchmark: 40-45 seconds
Pro Tip
💡Pro tip: Use CloudTalk’s Call Monitoring feature to track call duration in real-time, allowing you to identify efficiency trends, manage call times, and optimize agent performance.
Call Center Reporting Best Practices: How to Do It Right
Now you know some of the most important KPIs to track for call center reporting. That, though, is only part of the story. Here are some call center reporting best practices to ensure you produce the most useful call center reports possible.
#1 Focus on KPIs
KPIs are tracked and regularly presented to call center supervisors because they help you identify problem areas and design targeted solutions.
KPIs can encompass a broad range of call center performance areas related to business, customer service, and work processes. They give you an overview of how your call center is operating and point to improvement opportunities.
How to do it: Make sure to define which KPIs are most important to your call center and overall business aims. Then, use your call center reporting solution to focus individual reports on each.
#2 Research Industry Standards to Establish Performance Benchmarks
Tracking KPIs won’t get you anywhere unless you have a set of established, industry-standard benchmarks against which you can measure your progress.
Coming up with these benchmarks for your company will require a fair bit of market research. These benchmarks will allow you to frame your call center reports in the proper context and enable you to identify the areas of improvement.
Once you have these areas in mind, you can start crafting an improvement strategy for your business.
How to do it: Check out businesses and organizations that compile research in your niche. Read their reports and define benchmarks for your KPIs.
#3 Take a Big Picture View of How Metrics Relate to Operations
Always take a step back and consider the bigger picture. You want to run a call center operation that keeps your customers and employees happy.
You should be flexible in addressing the problems uncovered in your call center reports. If you’re open to new ideas, you’re more likely to find something that works especially well for your business.
How to do it: Don’t focus solely on metrics, KPIs, and numbers. Supplement your quantitative reporting by gathering information in other ways, too. Ask agents for their input and use surveys that give customers a chance to offer longer-form answers, for example.
#4 Set Goals For the Future and Track Them!
It’s as much a certainty in call center operations as it is in life: You won’t make any progress without first setting some goals for yourself.
Here are some examples of setting goals right:
- Have an exceptionally high average handle time? Schedule efficiency-focused training for your agents so they can start to bring that number down.
- Average after-call work time KPI off the charts? Consider using a modern telephony solution like CloudTalk, which can help drive down the amount of time agents spend on busywork after calls by automating the bulk of it.
- Is average call waiting time way over your benchmark? Customize your call routing to ensure callers reach an agent more quickly.
- Are you seeing a high blocked call rate? You might be short-staffed.
- Are customer sentiments running high on calls? Use CloudTalk’s Sentiment Analysis to identify frustrated or dissatisfied customers early, allowing agents to address concerns proactively and improve the overall customer experience.
No matter what you choose to do, be sure to track all of it over time and to keep your whole team up-to-date on your progress. One great way to do the latter is with a call center Wallboard. This way, you can quickly see what works for your business — and keep doing it! You can also use digital signage software to highlight top performers and motivate the team by showcasing achievements as they happen.
How to do it: Be clear on your goals for improvement. Pay particular attention to metrics and reports which directly reflect those goals. Use your call center software to collect relevant data in real time and glean actionable insights. Then, take steps to improve and track the results.
Examples of Call Center Dashboard Reporting
The best way to compile raw data for your call center reports is to use high-end call center reporting software.
CloudTalk more than fits the bill here. Our advanced, back-end data collection algorithms let call center managers kick back and watch the data roll in—via a Real-Time Dashboard.
With the burden of raw data collection off of their shoulders, managers can turn their attention to more meaningful tasks. For example, selecting their KPIs for finalized call center reports and developing improvement strategies for those areas that need the most attention.
Below we’ll get into some examples of how CloudTalk simplifies the data collection process and makes call center reporting easier than ever.
Call Center Report Sample
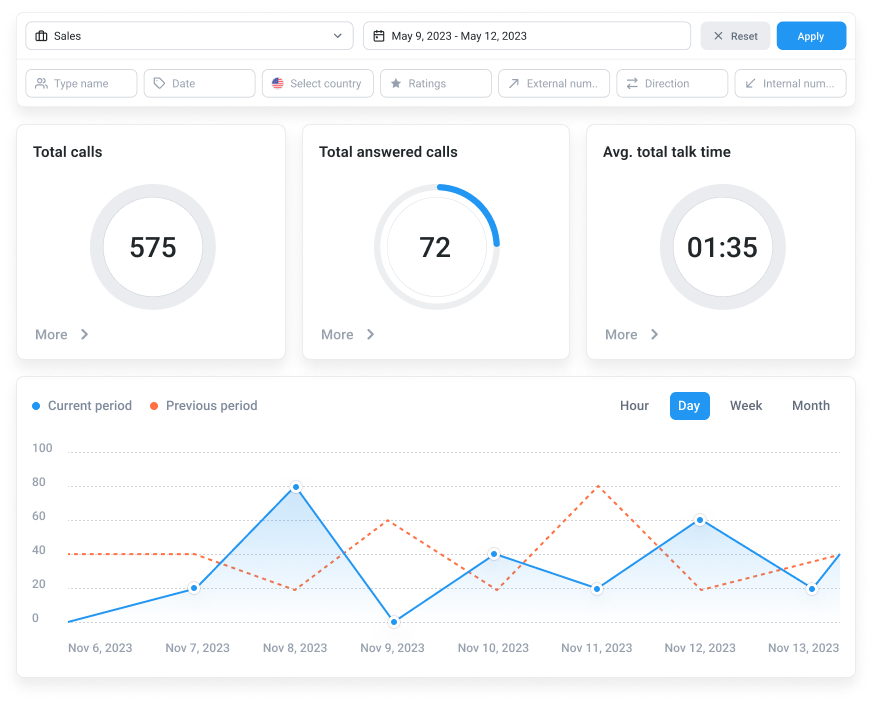
One great thing about CloudTalk is that it gives you easy access to call center real-time reporting. You can track several important call center reporting metrics as the data rolls in.
Under the Call History tab of your Statistics dashboard, for example, you’ll find a range of insights, including:
- The total number of calls your agents have fielded
- The total number of missed calls that slipped through the cracks
- The average duration of your agents’ calls
- The average amount of time your customers have had to wait during a given period
- And more.
You can use all of this data for your call center report or just bits and pieces of them — we leave it to your discretion.
Agent Productivity Dashboard
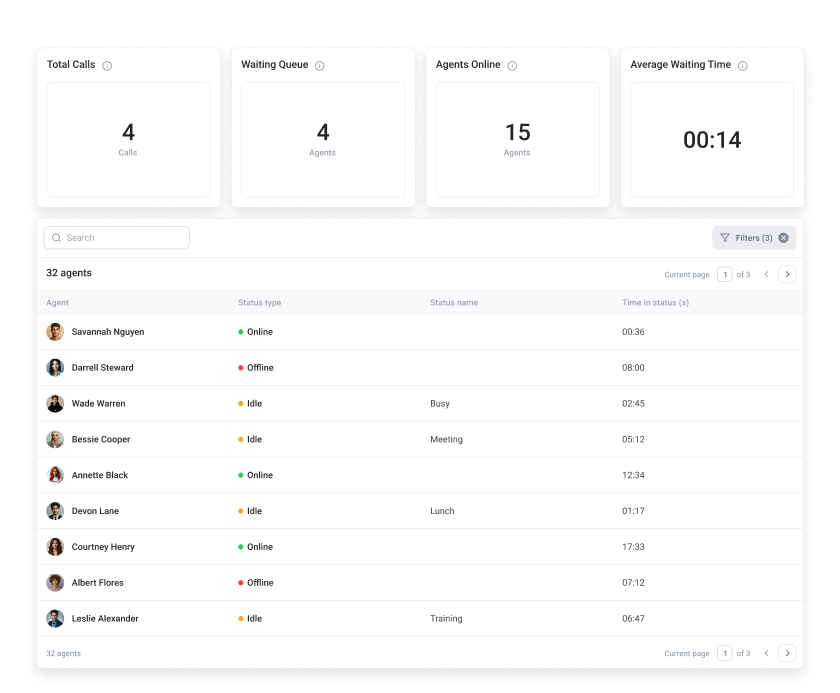
CloudTalk also gives managers the ability to filter call center statistics by agent, so you can analyze the work of your best-performing agents, worst-performing agents, and everyone in between. It’s a great way to get a proper overview of contact center team results.
For each agent, you can see:
- The total number of calls
- Average call duration
- Total number of inbound and outbound calls
You can also compare your agents side-by-side to get a broad view of your team’s performance.
If you’d like your call center report to highlight the performance of a particular agent over a given period, the agent productivity dashboard allows you to compile that data quickly and easily.
Test and Review Your Reporting to Get It Just Right
The testing and review process for contact center reports is a comprehensive, multi-step endeavor that — if done correctly — will ensure that the data you collect and the insights you draw from it are accurate and useful. Let’s get into the steps.
#1 Compile Preliminary Reports
The very first stage of the process is the development of your first draft, “alpha” reports. These will be a bit messy, and justifiably so — you’re gathering a great deal of raw data and attempting to categorize it into distinct (and useful!) KPIs. Once you’ve compiled your data and KPIs, you can move on to the next step.
#2 Double-Check Your Numbers
The calculations in your reports are prone to human error. It’s normal, and it’s why the verification of your calculations and formulas deserves its own step in the process.
You should circulate your contact center report throughout your design and analytics departments so people have a chance to catch any potential mathematical mistakes.
#3 Add Graphics and Design Features
Once your facts and figures have been polished, you can ship your report off to the design department. Their job is to spruce the thing up — to add graphics, charts, and other design elements that make your data pop off the page.
This step is awfully important in creating a presentable, easy-to-comprehend report that can offer meaningful guidance to all of your employees, regardless of their expertise.
#4 End-User Testing and Review
Now that your report has achieved a certain level of panache, you can send it out to a sample selection of call center managers and agents. This will be a real test of your report’s readability and will hopefully uncover any discrepancies in your data, awkward sections of text, or confusing graphics.
Of course, you should also pay special attention to feedback related to the usefulness of your report. After all, wanting to craft a useful document is why you went through the trouble of compiling the thing in the first place.
#5 Dissemination and Fine-Tuning
Finally, you can send your report out to a wider audience. This final step will see the fruition of all the hard work and will hopefully lead to improvement in problem areas you have identified.
Bear in mind that contact center reports are living documents, so using document collaboration tools can help you easily make edits or adjustments whenever the need arises. It can also be a good idea to create a call center report template once you’re happy with a final report. This document can provide a framework for creating future, similar reports.
If you’ve made it this far — congratulations! You’ve created, tested, and reviewed a document crucial to the long-term success of your call center. This industry moves fast, and your company relies on comprehensive, professional call center reports to keep up with its competition. So pat yourself on the back and get cracking on the next report!
Call Center Reports: Turn Data into Results
Comprehensive call center reports are key to the success of any modern call center. They present a bevy of important KPIs in a digestible manner so you can quickly understand which areas are high-priority targets for improvement.
They can also aid in the improvement process, as regular call center reports help determine whether or not a certain improvement strategy is working well. It’s a process that takes time, and while it’s worth every minute you dedicate to it, it’s also vital to make the process as efficient as possible.
That’s where cutting-edge call center reporting software like CloudTalk comes in. Cloudtalk offers customizable dashboards that offer real-time visibility into metrics like unanswered calls, average call duration, and wait times.
Backed with detailed reports on inbound and outbound calls, agent performance, and team productivity, you can improve your call center performance and elevate your CSAT score. Features like advanced filtering let you focus on key data points, while integration with your CRM ensures seamless access to all important customer data.
Turn your call center data into results
*Sources
- Amplifi. 80+ Customer Service Statistics You Need to Know. 2025.


